Class "unmarkedFrame"
unmarkedFrame-class.RdMethods for manipulating, summarizing and viewing unmarkedFrames
Objects from the Class
Objects can be created by calls to the constructor function
unmarkedFrame. These objects are passed to the data
argument of the fitting functions.
Slots
y:Object of class
"matrix"obsCovs:Object of class
"optionalDataFrame"siteCovs:Object of class
"optionalDataFrame"mapInfo:Object of class
"optionalMapInfo"obsToY:Object of class
"optionalMatrix"
Methods
- [
signature(x = "unmarkedFrame", i = "numeric", j =
	"missing", drop = "missing")
: ...- [
signature(x = "unmarkedFrame", i = "numeric", j =
	"numeric", drop = "missing")
: ...- [
signature(x = "unmarkedFrame", i = "missing", j =
	"numeric", drop = "missing")
: ...- coordinates
signature(object = "unmarkedFrame"): extract coordinates- getY
signature(object = "unmarkedFrame"): extract y matrix- numSites
signature(object = "unmarkedFrame"): extract M- numY
signature(object = "unmarkedFrame"): extract ncol(y)- obsCovs
signature(object = "unmarkedFrame"): extract observation-level covariates- obsCovs<-
signature(object = "unmarkedFrame"): add or modify observation-level covariates- obsNum
signature(object = "unmarkedFrame"): extract number of observations- obsToY
signature(object = "unmarkedFrame"):- obsToY<-
signature(object = "unmarkedFrame"): ...- plot
signature(x = "unmarkedFrame", y = "missing"): visualize response variable. Takes additional argumentpanelswhich specifies how many panels data should be split over.- projection
signature(object = "unmarkedFrame"): extract projection information- show
signature(object = "unmarkedFrame"): view data as data.frame- siteCovs
signature(object = "unmarkedFrame"): extract site-level covariates- siteCovs<-
signature(object = "unmarkedFrame"): add or modify site-level covariates- summary
signature(object = "unmarkedFrame"): summarize data- getL
signature(object = "unmarkedFrameOccuCOP"): extract L
Note
This is a superclass with child classes for each fitting function.
See also
Examples
# List all the child classes of unmarkedFrame
showClass("unmarkedFrame")
#> Class "unmarkedFrame" [package "unmarked"]
#>
#> Slots:
#>
#> Name: y obsCovs siteCovs mapInfo
#> Class: matrix optionalDataFrame optionalDataFrame optionalMapInfo
#>
#> Name: obsToY
#> Class: optionalMatrix
#>
#> Extends: "unmarkedFrameOrNULL"
#>
#> Known Subclasses:
#> Class "unmarkedMultFrame", directly
#> Class "unmarkedFrameDS", directly
#> Class "unmarkedFrameOccu", directly
#> Class "unmarkedFrameOccuFP", directly
#> Class "unmarkedFrameOccuMulti", directly
#> Class "unmarkedFramePCount", directly
#> Class "unmarkedFrameMPois", directly
#> Class "unmarkedFrameOccuCOP", directly
#> Class "unmarkedFrameOccuMS", by class "unmarkedMultFrame", distance 2
#> Class "unmarkedFrameOccuTTD", by class "unmarkedMultFrame", distance 2
#> Class "unmarkedFrameG3", by class "unmarkedMultFrame", distance 2
#> Class "unmarkedFramePCO", by class "unmarkedMultFrame", distance 2
#> Class "unmarkedFrameGDR", by class "unmarkedMultFrame", distance 2
#> Class "unmarkedFrameGMM", by class "unmarkedMultFrame", distance 3
#> Class "unmarkedFrameGDS", by class "unmarkedMultFrame", distance 3
#> Class "unmarkedFrameGPC", by class "unmarkedMultFrame", distance 3
#> Class "unmarkedFrameGOccu", by class "unmarkedMultFrame", distance 3
#> Class "unmarkedFrameMMO", by class "unmarkedMultFrame", distance 4
#> Class "unmarkedFrameDSO", by class "unmarkedMultFrame", distance 4
# Organize data for pcount()
data(mallard)
mallardUMF <- unmarkedFramePCount(mallard.y, siteCovs = mallard.site,
obsCovs = mallard.obs)
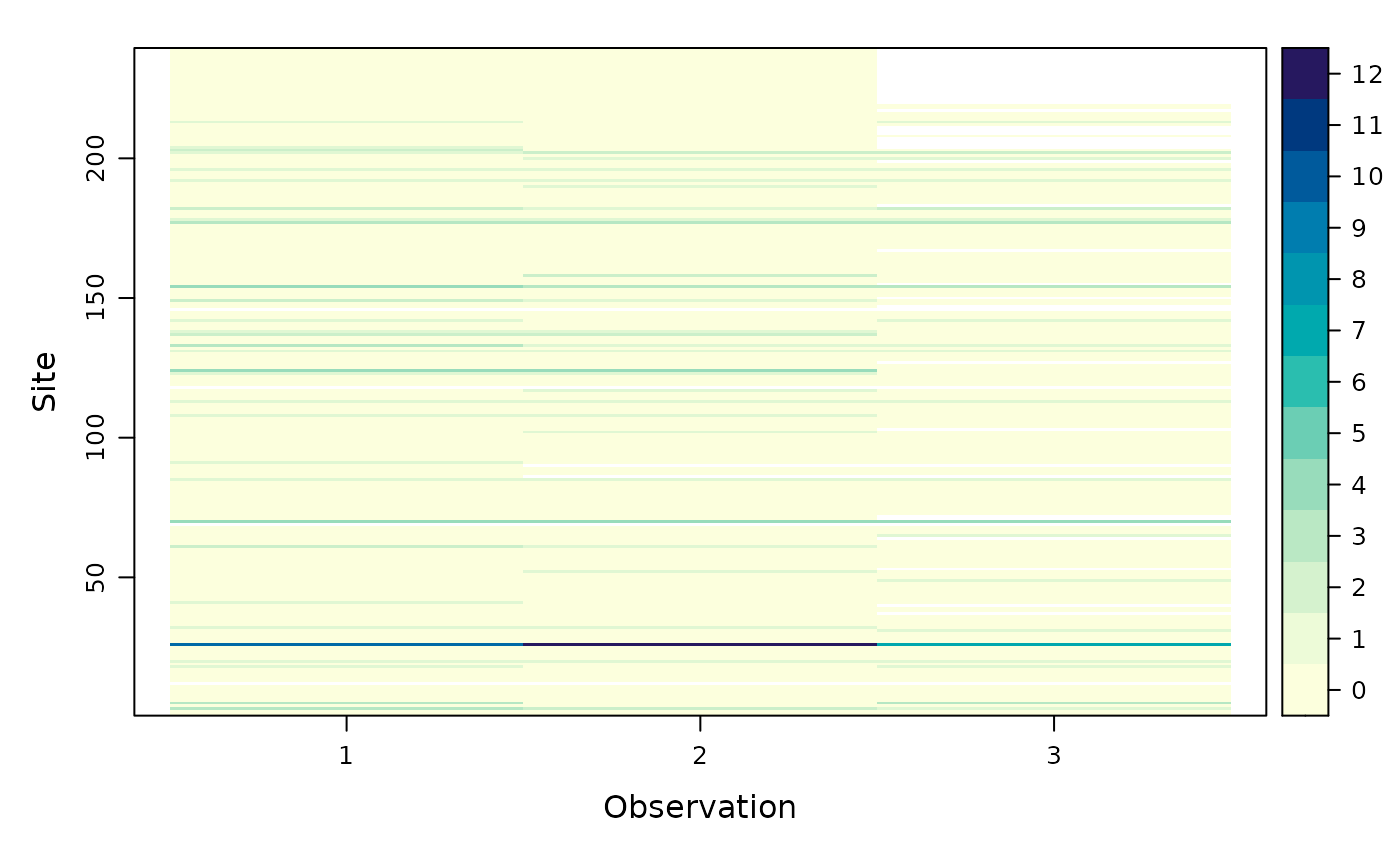
# Vizualize it
plot(mallardUMF)
 mallardUMF
#> Data frame representation of unmarkedFrame object.
#> y.1 y.2 y.3 elev length forest ivel.1 ivel.2 ivel.3 date.1 date.2 date.3
#> 1 0 0 0 -1.173 0.801 -1.156 -0.506 -0.506 -0.506 -1.761 0.310 1.381
#> 2 0 0 0 -1.127 0.115 -0.501 -0.934 -0.991 -1.162 -2.904 -1.047 0.596
#> 3 3 2 1 -0.198 -0.479 -0.101 -1.136 -1.339 -1.610 -1.690 -0.476 1.453
#> 4 0 0 0 -0.105 0.315 0.008 -0.819 -0.927 -1.197 -2.190 -0.690 1.239
#> [ reached 'max' / getOption("max.print") -- omitted 235 rows ]
# Summarize it
summary(mallardUMF)
#> unmarkedFrame Object
#>
#> 239 sites
#> Maximum number of observations per site: 3
#> Mean number of observations per site: 2.76
#> Sites with at least one detection: 40
#>
#> Tabulation of y observations:
#> 0 1 2 3 4 7 10 12 <NA>
#> 576 54 11 9 6 1 1 1 58
#>
#> Site-level covariates:
#> elev length forest
#> Min. :-1.436000 Min. :-4.945000 Min. :-1.2650000
#> 1st Qu.:-0.956500 1st Qu.:-0.563000 1st Qu.:-0.9560000
#> Median :-0.198000 Median : 0.045000 Median :-0.0650000
#> Mean :-0.000046 Mean :-0.000029 Mean : 0.0000669
#> 3rd Qu.: 0.994000 3rd Qu.: 0.626000 3rd Qu.: 0.7900000
#> Max. : 2.434000 Max. : 2.255000 Max. : 2.2990000
#>
#> Observation-level covariates:
#> ivel date
#> Min. :-1.75300 Min. :-2.90400
#> 1st Qu.:-0.66600 1st Qu.:-1.11900
#> Median :-0.13900 Median :-0.11900
#> Mean : 0.00002 Mean : 0.00007
#> 3rd Qu.: 0.54900 3rd Qu.: 1.31000
#> Max. : 5.98000 Max. : 3.81000
#> NA's :52 NA's :42
str(mallardUMF)
#> Formal class 'unmarkedFramePCount' [package "unmarked"] with 5 slots
#> ..@ y : num [1:239, 1:3] 0 0 3 0 3 0 0 0 0 0 ...
#> .. ..- attr(*, "dimnames")=List of 2
#> .. .. ..$ : NULL
#> .. .. ..$ : chr [1:3] "y.1" "y.2" "y.3"
#> ..@ obsCovs :'data.frame': 717 obs. of 2 variables:
#> .. ..$ ivel: num [1:717] -0.506 -0.506 -0.506 -0.934 -0.991 ...
#> .. ..$ date: num [1:717] -1.76 0.31 1.38 -2.9 -1.05 ...
#> ..@ siteCovs:'data.frame': 239 obs. of 3 variables:
#> .. ..$ elev : num [1:239] -1.173 -1.127 -0.198 -0.105 -1.034 ...
#> .. ..$ length: num [1:239] 0.801 0.115 -0.479 0.315 -1.102 ...
#> .. ..$ forest: num [1:239] -1.156 -0.501 -0.101 0.008 -1.193 ...
#> ..@ mapInfo : NULL
#> ..@ obsToY : num [1:3, 1:3] 1 0 0 0 1 0 0 0 1
numSites(mallardUMF)
#> [1] 239
numY(mallardUMF)
#> [1] 3
obsNum(mallardUMF)
#> [1] 3
# Extract components of data
getY(mallardUMF)
#> y.1 y.2 y.3
#> [1,] 0 0 0
#> [2,] 0 0 0
#> [3,] 3 2 1
#> [4,] 0 0 0
#> [5,] 3 0 3
#> [6,] 0 0 0
#> [7,] 0 0 0
#> [8,] 0 0 0
#> [9,] 0 0 0
#> [10,] 0 0 0
#> [11,] 0 0 0
#> [12,] NA NA NA
#> [13,] 0 0 0
#> [14,] 0 0 0
#> [15,] 0 0 0
#> [16,] 0 0 0
#> [ reached getOption("max.print") -- omitted 223 rows ]
obsCovs(mallardUMF)
#> ivel date
#> 1 -0.506 -1.761
#> 2 -0.506 0.310
#> 3 -0.506 1.381
#> 4 -0.934 -2.904
#> 5 -0.991 -1.047
#> 6 -1.162 0.596
#> 7 -1.136 -1.690
#> 8 -1.339 -0.476
#> 9 -1.610 1.453
#> 10 -0.819 -2.190
#> 11 -0.927 -0.690
#> 12 -1.197 1.239
#> 13 0.638 -1.833
#> 14 0.880 0.167
#> 15 1.042 1.381
#> 16 -1.329 -2.619
#> 17 -1.042 0.167
#> 18 -0.899 1.381
#> 19 -1.448 -2.690
#> 20 -1.562 -1.190
#> 21 -1.676 1.596
#> 22 -0.321 -2.119
#> 23 -0.557 -0.476
#> 24 -0.636 1.453
#> 25 -0.231 -2.047
#> [ reached 'max' / getOption("max.print") -- omitted 692 rows ]
obsCovs(mallardUMF, matrices = TRUE)
#> $ivel
#> [,1] [,2] [,3]
#> [1,] -0.506 -0.506 -0.506
#> [2,] -0.934 -0.991 -1.162
#> [3,] -1.136 -1.339 -1.610
#> [4,] -0.819 -0.927 -1.197
#> [5,] 0.638 0.880 1.042
#> [6,] -1.329 -1.042 -0.899
#> [7,] -1.448 -1.562 -1.676
#> [8,] -0.321 -0.557 -0.636
#> [9,] -0.231 -0.231 -0.001
#> [10,] -1.097 -1.021 -0.832
#> [11,] -0.224 0.058 -0.224
#> [12,] NA NA NA
#> [13,] 0.417 0.284 0.549
#> [14,] -1.354 -1.014 -1.159
#> [15,] -1.117 -0.224 -0.788
#> [16,] -0.278 -0.182 0.009
#> [ reached getOption("max.print") -- omitted 223 rows ]
#>
#> $date
#> [,1] [,2] [,3]
#> [1,] -1.761 0.310 1.381
#> [2,] -2.904 -1.047 0.596
#> [3,] -1.690 -0.476 1.453
#> [4,] -2.190 -0.690 1.239
#> [5,] -1.833 0.167 1.381
#> [6,] -2.619 0.167 1.381
#> [7,] -2.690 -1.190 1.596
#> [8,] -2.119 -0.476 1.453
#> [9,] -2.047 -0.547 1.167
#> [10,] -2.333 -1.119 -0.261
#> [11,] -1.690 0.453 1.453
#> [12,] -1.047 0.739 2.596
#> [13,] -1.833 -0.333 1.953
#> [14,] -0.904 1.096 1.239
#> [15,] -2.547 -0.261 1.310
#> [16,] -1.333 0.310 1.524
#> [ reached getOption("max.print") -- omitted 223 rows ]
#>
siteCovs(mallardUMF)
#> elev length forest
#> 1 -1.173 0.801 -1.156
#> 2 -1.127 0.115 -0.501
#> 3 -0.198 -0.479 -0.101
#> 4 -0.105 0.315 0.008
#> 5 -1.034 -1.102 -1.193
#> 6 -0.848 0.741 0.917
#> 7 -0.910 0.115 -1.083
#> 8 -1.003 -1.007 -0.792
#> 9 -0.058 -0.913 0.553
#> 10 -0.631 1.556 0.808
#> 11 0.066 -1.626 1.790
#> 12 -0.709 1.647 -0.720
#> 13 -1.111 -0.399 -0.647
#> 14 -0.260 0.685 0.844
#> 15 -0.647 0.801 -0.320
#> 16 0.189 0.741 -0.101
#> [ reached 'max' / getOption("max.print") -- omitted 223 rows ]
mallardUMF[1:5,] # First 5 rows in wide format
#> Data frame representation of unmarkedFrame object.
#> y.1 y.2 y.3 elev length forest ivel.1 ivel.2 ivel.3 date.1 date.2 date.3
#> 1 0 0 0 -1.173 0.801 -1.156 -0.506 -0.506 -0.506 -1.761 0.310 1.381
#> 2 0 0 0 -1.127 0.115 -0.501 -0.934 -0.991 -1.162 -2.904 -1.047 0.596
#> 3 3 2 1 -0.198 -0.479 -0.101 -1.136 -1.339 -1.610 -1.690 -0.476 1.453
#> 4 0 0 0 -0.105 0.315 0.008 -0.819 -0.927 -1.197 -2.190 -0.690 1.239
#> [ reached 'max' / getOption("max.print") -- omitted 1 rows ]
mallardUMF[,1:2] # First 2 observations
#> Data frame representation of unmarkedFrame object.
#> y.1 y.2 elev length forest ivel.1 ivel.2 date.1 date.2
#> 1 0 0 -1.173 0.801 -1.156 -0.506 -0.506 -1.761 0.310
#> 2 0 0 -1.127 0.115 -0.501 -0.934 -0.991 -2.904 -1.047
#> 3 3 2 -0.198 -0.479 -0.101 -1.136 -1.339 -1.690 -0.476
#> 4 0 0 -0.105 0.315 0.008 -0.819 -0.927 -2.190 -0.690
#> 5 3 0 -1.034 -1.102 -1.193 0.638 0.880 -1.833 0.167
#> [ reached 'max' / getOption("max.print") -- omitted 234 rows ]
mallardUMF
#> Data frame representation of unmarkedFrame object.
#> y.1 y.2 y.3 elev length forest ivel.1 ivel.2 ivel.3 date.1 date.2 date.3
#> 1 0 0 0 -1.173 0.801 -1.156 -0.506 -0.506 -0.506 -1.761 0.310 1.381
#> 2 0 0 0 -1.127 0.115 -0.501 -0.934 -0.991 -1.162 -2.904 -1.047 0.596
#> 3 3 2 1 -0.198 -0.479 -0.101 -1.136 -1.339 -1.610 -1.690 -0.476 1.453
#> 4 0 0 0 -0.105 0.315 0.008 -0.819 -0.927 -1.197 -2.190 -0.690 1.239
#> [ reached 'max' / getOption("max.print") -- omitted 235 rows ]
# Summarize it
summary(mallardUMF)
#> unmarkedFrame Object
#>
#> 239 sites
#> Maximum number of observations per site: 3
#> Mean number of observations per site: 2.76
#> Sites with at least one detection: 40
#>
#> Tabulation of y observations:
#> 0 1 2 3 4 7 10 12 <NA>
#> 576 54 11 9 6 1 1 1 58
#>
#> Site-level covariates:
#> elev length forest
#> Min. :-1.436000 Min. :-4.945000 Min. :-1.2650000
#> 1st Qu.:-0.956500 1st Qu.:-0.563000 1st Qu.:-0.9560000
#> Median :-0.198000 Median : 0.045000 Median :-0.0650000
#> Mean :-0.000046 Mean :-0.000029 Mean : 0.0000669
#> 3rd Qu.: 0.994000 3rd Qu.: 0.626000 3rd Qu.: 0.7900000
#> Max. : 2.434000 Max. : 2.255000 Max. : 2.2990000
#>
#> Observation-level covariates:
#> ivel date
#> Min. :-1.75300 Min. :-2.90400
#> 1st Qu.:-0.66600 1st Qu.:-1.11900
#> Median :-0.13900 Median :-0.11900
#> Mean : 0.00002 Mean : 0.00007
#> 3rd Qu.: 0.54900 3rd Qu.: 1.31000
#> Max. : 5.98000 Max. : 3.81000
#> NA's :52 NA's :42
str(mallardUMF)
#> Formal class 'unmarkedFramePCount' [package "unmarked"] with 5 slots
#> ..@ y : num [1:239, 1:3] 0 0 3 0 3 0 0 0 0 0 ...
#> .. ..- attr(*, "dimnames")=List of 2
#> .. .. ..$ : NULL
#> .. .. ..$ : chr [1:3] "y.1" "y.2" "y.3"
#> ..@ obsCovs :'data.frame': 717 obs. of 2 variables:
#> .. ..$ ivel: num [1:717] -0.506 -0.506 -0.506 -0.934 -0.991 ...
#> .. ..$ date: num [1:717] -1.76 0.31 1.38 -2.9 -1.05 ...
#> ..@ siteCovs:'data.frame': 239 obs. of 3 variables:
#> .. ..$ elev : num [1:239] -1.173 -1.127 -0.198 -0.105 -1.034 ...
#> .. ..$ length: num [1:239] 0.801 0.115 -0.479 0.315 -1.102 ...
#> .. ..$ forest: num [1:239] -1.156 -0.501 -0.101 0.008 -1.193 ...
#> ..@ mapInfo : NULL
#> ..@ obsToY : num [1:3, 1:3] 1 0 0 0 1 0 0 0 1
numSites(mallardUMF)
#> [1] 239
numY(mallardUMF)
#> [1] 3
obsNum(mallardUMF)
#> [1] 3
# Extract components of data
getY(mallardUMF)
#> y.1 y.2 y.3
#> [1,] 0 0 0
#> [2,] 0 0 0
#> [3,] 3 2 1
#> [4,] 0 0 0
#> [5,] 3 0 3
#> [6,] 0 0 0
#> [7,] 0 0 0
#> [8,] 0 0 0
#> [9,] 0 0 0
#> [10,] 0 0 0
#> [11,] 0 0 0
#> [12,] NA NA NA
#> [13,] 0 0 0
#> [14,] 0 0 0
#> [15,] 0 0 0
#> [16,] 0 0 0
#> [ reached getOption("max.print") -- omitted 223 rows ]
obsCovs(mallardUMF)
#> ivel date
#> 1 -0.506 -1.761
#> 2 -0.506 0.310
#> 3 -0.506 1.381
#> 4 -0.934 -2.904
#> 5 -0.991 -1.047
#> 6 -1.162 0.596
#> 7 -1.136 -1.690
#> 8 -1.339 -0.476
#> 9 -1.610 1.453
#> 10 -0.819 -2.190
#> 11 -0.927 -0.690
#> 12 -1.197 1.239
#> 13 0.638 -1.833
#> 14 0.880 0.167
#> 15 1.042 1.381
#> 16 -1.329 -2.619
#> 17 -1.042 0.167
#> 18 -0.899 1.381
#> 19 -1.448 -2.690
#> 20 -1.562 -1.190
#> 21 -1.676 1.596
#> 22 -0.321 -2.119
#> 23 -0.557 -0.476
#> 24 -0.636 1.453
#> 25 -0.231 -2.047
#> [ reached 'max' / getOption("max.print") -- omitted 692 rows ]
obsCovs(mallardUMF, matrices = TRUE)
#> $ivel
#> [,1] [,2] [,3]
#> [1,] -0.506 -0.506 -0.506
#> [2,] -0.934 -0.991 -1.162
#> [3,] -1.136 -1.339 -1.610
#> [4,] -0.819 -0.927 -1.197
#> [5,] 0.638 0.880 1.042
#> [6,] -1.329 -1.042 -0.899
#> [7,] -1.448 -1.562 -1.676
#> [8,] -0.321 -0.557 -0.636
#> [9,] -0.231 -0.231 -0.001
#> [10,] -1.097 -1.021 -0.832
#> [11,] -0.224 0.058 -0.224
#> [12,] NA NA NA
#> [13,] 0.417 0.284 0.549
#> [14,] -1.354 -1.014 -1.159
#> [15,] -1.117 -0.224 -0.788
#> [16,] -0.278 -0.182 0.009
#> [ reached getOption("max.print") -- omitted 223 rows ]
#>
#> $date
#> [,1] [,2] [,3]
#> [1,] -1.761 0.310 1.381
#> [2,] -2.904 -1.047 0.596
#> [3,] -1.690 -0.476 1.453
#> [4,] -2.190 -0.690 1.239
#> [5,] -1.833 0.167 1.381
#> [6,] -2.619 0.167 1.381
#> [7,] -2.690 -1.190 1.596
#> [8,] -2.119 -0.476 1.453
#> [9,] -2.047 -0.547 1.167
#> [10,] -2.333 -1.119 -0.261
#> [11,] -1.690 0.453 1.453
#> [12,] -1.047 0.739 2.596
#> [13,] -1.833 -0.333 1.953
#> [14,] -0.904 1.096 1.239
#> [15,] -2.547 -0.261 1.310
#> [16,] -1.333 0.310 1.524
#> [ reached getOption("max.print") -- omitted 223 rows ]
#>
siteCovs(mallardUMF)
#> elev length forest
#> 1 -1.173 0.801 -1.156
#> 2 -1.127 0.115 -0.501
#> 3 -0.198 -0.479 -0.101
#> 4 -0.105 0.315 0.008
#> 5 -1.034 -1.102 -1.193
#> 6 -0.848 0.741 0.917
#> 7 -0.910 0.115 -1.083
#> 8 -1.003 -1.007 -0.792
#> 9 -0.058 -0.913 0.553
#> 10 -0.631 1.556 0.808
#> 11 0.066 -1.626 1.790
#> 12 -0.709 1.647 -0.720
#> 13 -1.111 -0.399 -0.647
#> 14 -0.260 0.685 0.844
#> 15 -0.647 0.801 -0.320
#> 16 0.189 0.741 -0.101
#> [ reached 'max' / getOption("max.print") -- omitted 223 rows ]
mallardUMF[1:5,] # First 5 rows in wide format
#> Data frame representation of unmarkedFrame object.
#> y.1 y.2 y.3 elev length forest ivel.1 ivel.2 ivel.3 date.1 date.2 date.3
#> 1 0 0 0 -1.173 0.801 -1.156 -0.506 -0.506 -0.506 -1.761 0.310 1.381
#> 2 0 0 0 -1.127 0.115 -0.501 -0.934 -0.991 -1.162 -2.904 -1.047 0.596
#> 3 3 2 1 -0.198 -0.479 -0.101 -1.136 -1.339 -1.610 -1.690 -0.476 1.453
#> 4 0 0 0 -0.105 0.315 0.008 -0.819 -0.927 -1.197 -2.190 -0.690 1.239
#> [ reached 'max' / getOption("max.print") -- omitted 1 rows ]
mallardUMF[,1:2] # First 2 observations
#> Data frame representation of unmarkedFrame object.
#> y.1 y.2 elev length forest ivel.1 ivel.2 date.1 date.2
#> 1 0 0 -1.173 0.801 -1.156 -0.506 -0.506 -1.761 0.310
#> 2 0 0 -1.127 0.115 -0.501 -0.934 -0.991 -2.904 -1.047
#> 3 3 2 -0.198 -0.479 -0.101 -1.136 -1.339 -1.690 -0.476
#> 4 0 0 -0.105 0.315 0.008 -0.819 -0.927 -2.190 -0.690
#> 5 3 0 -1.034 -1.102 -1.193 0.638 0.880 -1.833 0.167
#> [ reached 'max' / getOption("max.print") -- omitted 234 rows ]