Swiss landscape data
Switzerland.RdSpatially-referenced data on elevation, forest cover, and water at a 1km-sq resolution.
data(Switzerland)Format
A data frame with 42275 observations on the following 5 variables.
xEasting (m)
yNorthing (m)
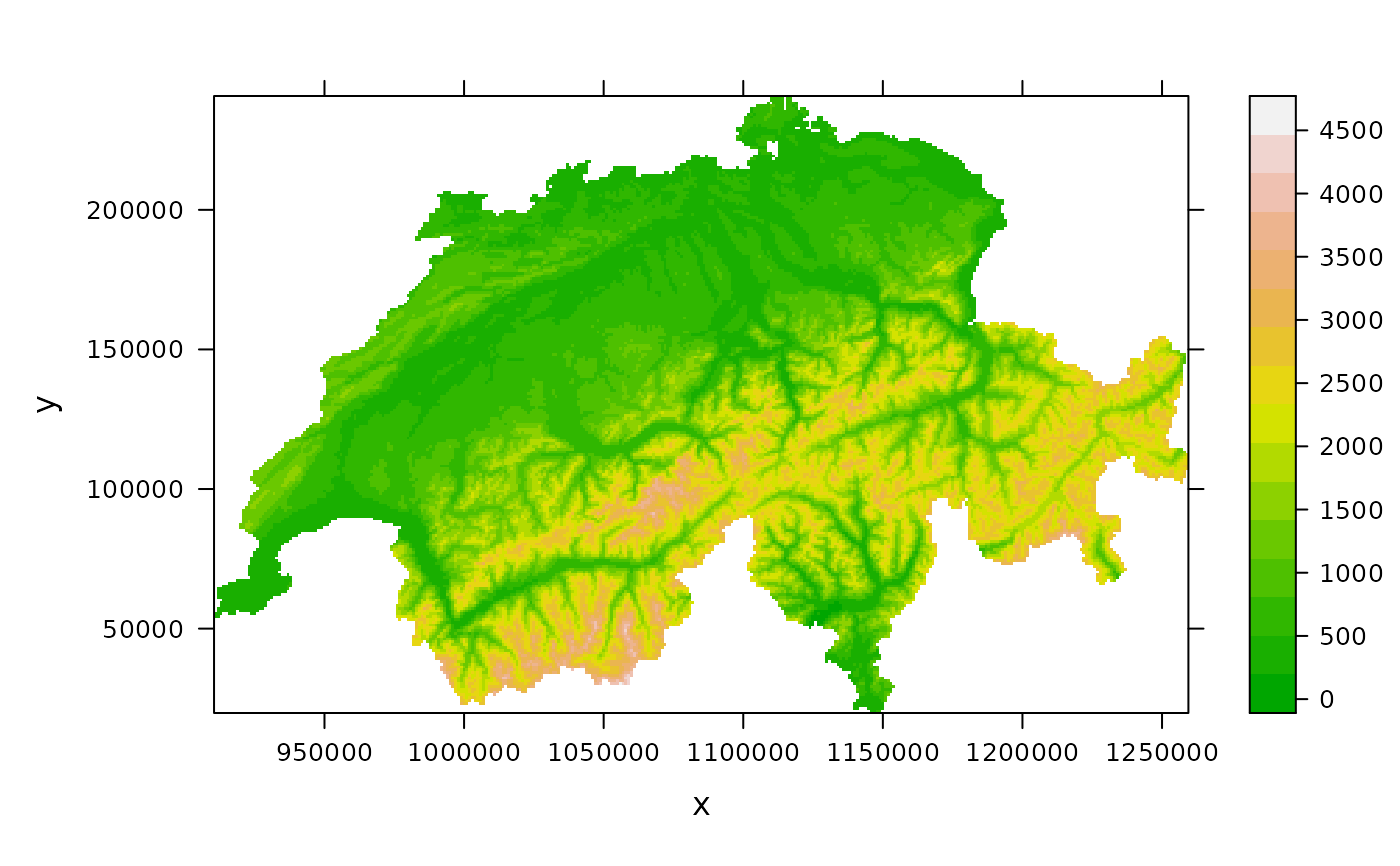
elevationa numeric vector (m)
foresta numeric vector (percent cover)
watera numeric vector (percent cover)
Details
Forest and water coverage (in percent area) was computed using the 1992-97 landcover dataset of the Swiss Federal Statistical Office (http://www.bfs.admin.ch). Median elevation (in metres) was computed using a median aggregation of the digital elevation model of the Swiss Federal Statistical Office.
x and y are the coordinates of the center of each 1km2 pixel.
The coordinate reference system intentionally not specified.
These data can only be used for non-profit projects. Otherwise, written permission must be obtained from the Swiss Federal Statistical Office
Source
Swiss Federal Statistical Office (http://www.bfs.admin.ch)
Examples
library(lattice)
data(Switzerland)
str(Switzerland)
#> 'data.frame':	42275 obs. of  5 variables:
#>  $ x        : int  910942 910942 911942 911942 911942 911942 911942 911942 911942 911942 ...
#>  $ y        : int  54276 55276 54276 55276 56276 57276 61276 62276 63276 64276 ...
#>  $ elevation: int  340 340 380 390 357 357 500 472 462 472 ...
#>  $ forest   : int  6 11 4 72 9 5 0 43 6 0 ...
#>  $ water    : int  0 1 0 3 7 5 0 0 0 0 ...

levelplot(elevation ~ x + y, Switzerland, aspect="iso",
    col.regions=terrain.colors(100))


if (FALSE) { # \dontrun{
library(raster)
el.r <- rasterFromXYZ(Switzerland[,c("x","y","elevation")], crs =
"+proj=somerc +lat_0=46.95240555555556 +lon_0=7.439583333333333
+k_0=1 +x_0=600000 +y_0=200000 +ellps=bessel
+towgs84=674.374,15.056,405.346,0,0,0,0 +units=m +no_defs")
plot(el.r)
spplot(el.r)
} # }